-
Your guide to Rock Port, Missouri assisted living facilities. With so many senior housing options available, how do you know which one is right for your family?
Our Senior Living Advisors live in the Rock Port area and can provide you with an insider's view of local communities including pricing information and distinctive features.
Request information online by filling out the form to the right or call us at 855-363-2002 for a no-cost, in-depth assessment of your senior care needs. Our compassionate advisors can help you find the best Rock Port assisted living facilities for your unique needs and budget.
The official website for the city of Rock Port is http://rpmo.com/.
-
Assisted Living Costs in Nearby Cities
* The costs above represent the AVERAGE monthly cost of assisted living for a one person bedroom in that city. -

Facts about Rock Port
Rock Port is also known as: Atchison County / Rock Port city.
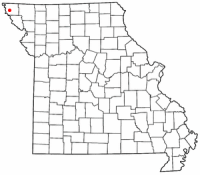
Rock Port is a city and county seat of Atchison County, Missouri, United States. The population was 1,318 at the 2010 census.
-
Population shifts in Rock Port
-
Average temperatures in Rock Port
Line in orange is average highs...line in blue is average lows.
Average rainfall in Rock Port
Rock Port Missouri Assisted Living Facilities
Other communities in Rock Port
Nearby communities in other cities
Windsor Manor Shenandoah
Nutritious meals are provided to residents, speech therapy is offered via a speech therapist who comes to the property often, residents can self manage their diabetes, staff is available help with your diabetes management, this community has been built specifically for memory and dementia care, the community has a nurse that is able to administer injectable medicine, and this community was built in 2012.Morton Place
Caregivers at Morton Place can address potential disorientation presented by residents, caregiver staff can deal with any wandering issues a member of the community may have, caregivers can handle residents that may present a danger to themselves, trained staff monitors medication and reminds residents when it’s time to take them, the community has a nurse that is able to administer injectable medicine, wheelchair accessible showers are available at this location, and the community is licensed for 30 residents.Eiler Place
Physical therapy is handled by the physical therapist that makes regular visits to this property, regular occupational therapy by a visiting therapist helps you stay active and engaged, the property is secured for the safety of memory care patients that might be prone to wander, the Eiler Place is specifically equipped to handle memory care and behavioral issues, Eiler Place has the skill to resolve any aggressive behavior that residents may present, the community has a nurse that is able to administer injectable medicine, and complimentary transportation is at the disposal of residents.Bristol Manor Of Maryville
Appetizing and expertly prepared meals are provided to all residents even those with dietary restrictions, 55 is the minimum age allowed for residents, a visiting dentist helps residents maintain their dental health, physical therapy can be done without leaving the community by a visiting physical therapist, complimentary transportation is available to residents, transportation at cost can be arranged, and this community was built in 1995.The Waterford at Woodbridge
Kosher food is provided, the minimum allowable age of residents is 55, a podiatrist visits the community to address any issues related to your feet, caregivers at The Waterford at Woodbridge are trained to spot potential disorientation presented by residents, this community administers patient medications, wheelchair accessible showers are available at this location, and full tubs are available.Arlington Place of Red Oak
Physical therapy can be done without leaving the community by a visiting physical therapist, residents can self manage their diabetic care, the facility has staff that can help you with your insulin to manage diabetic needs, staff is trained to deal with any wandering behaviors that may need to be handled, residents who need help with medication management can be given reminders and be monitored to make sure they are taking their medications, this community administers patient medications, and complimentary transportation is on hand for residents.If you represent a community listed above and would like to claim your listing, please contact us.


